Interactive plots with plotly and ggplotly recitation
Week 12
Intoduction
Today we are going to work with whole genome sequencing of the pig gut microbiome.
Pig gut microbiome data
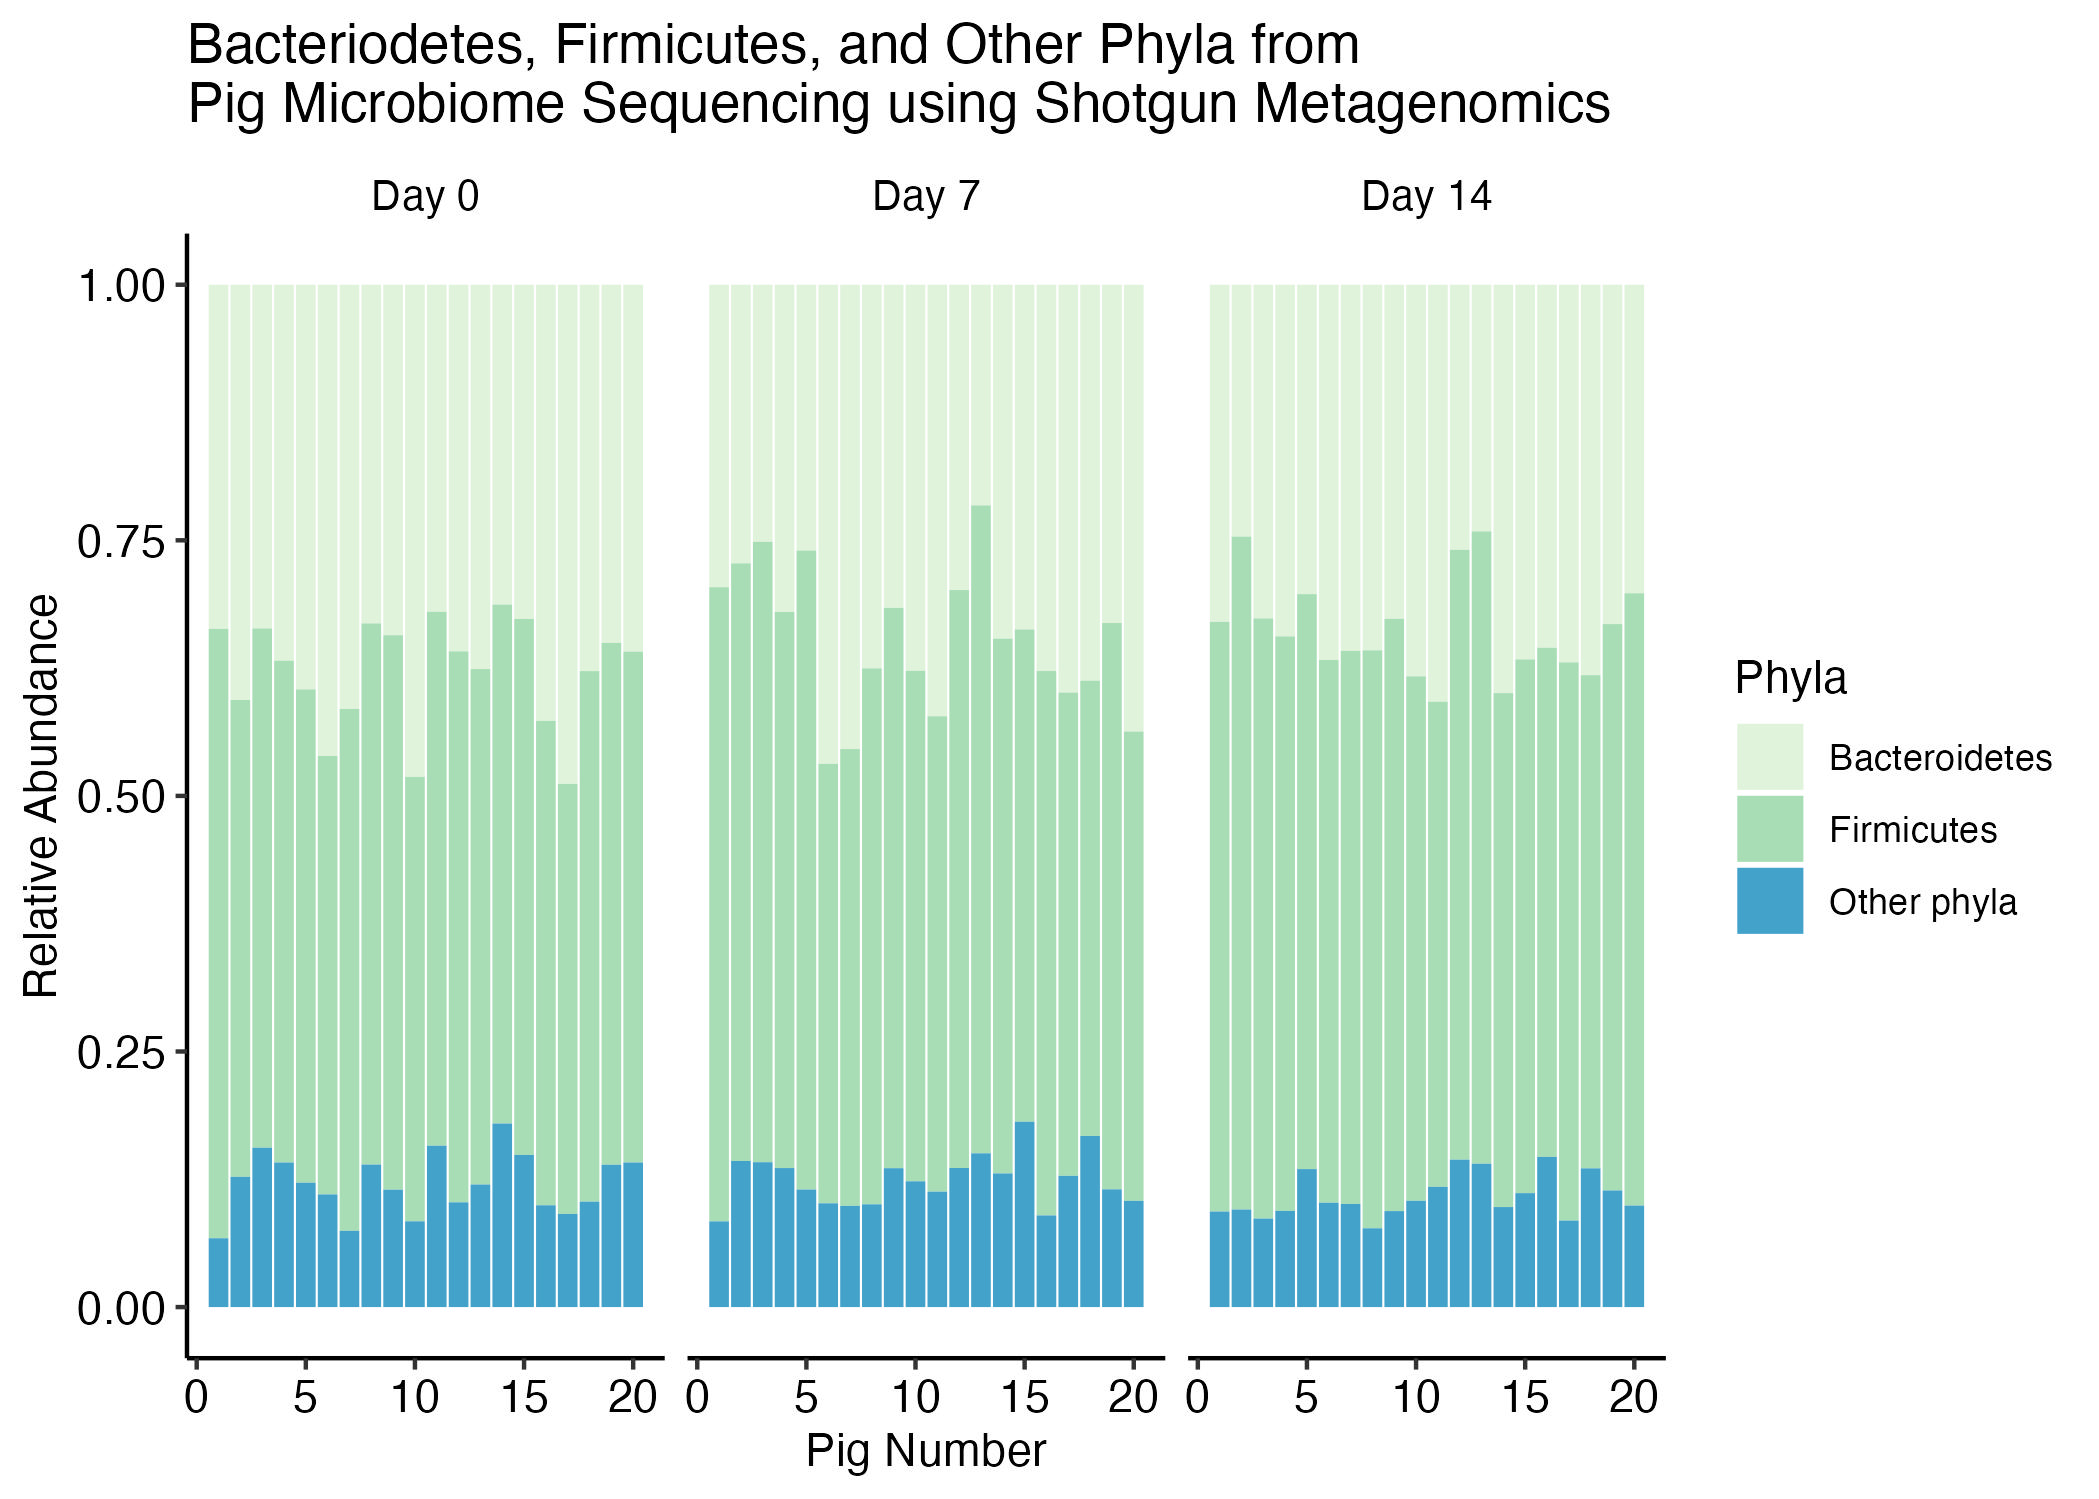
The goal of this recitation is to replicate the following plot, which shows the relative abundance of the phyla Bacteroidetes and Firmicutes to all the others.
How many rows and columns do the data have?
How many phyla do the data contains and how many columns represents metadata of the experiment?
Create a new column with a new phyla assignation
Keep the phyla when they are Firmicutes or Bacteroidetes, otherwise assign Phyla to “Other phyla”.
Need a hint? (Click to expand)
Hint: You may need to pivot the data to evaluate the column names as observations
Compute the cumulative abundance by the new Phyla levels that you created
Create the bar plot in ggplot
Make your plot interactive
ggplotly(your_awesome_plot)