2 - Good and Bad Data Visualizations
Week 2
💻 🧰 📊 🥳
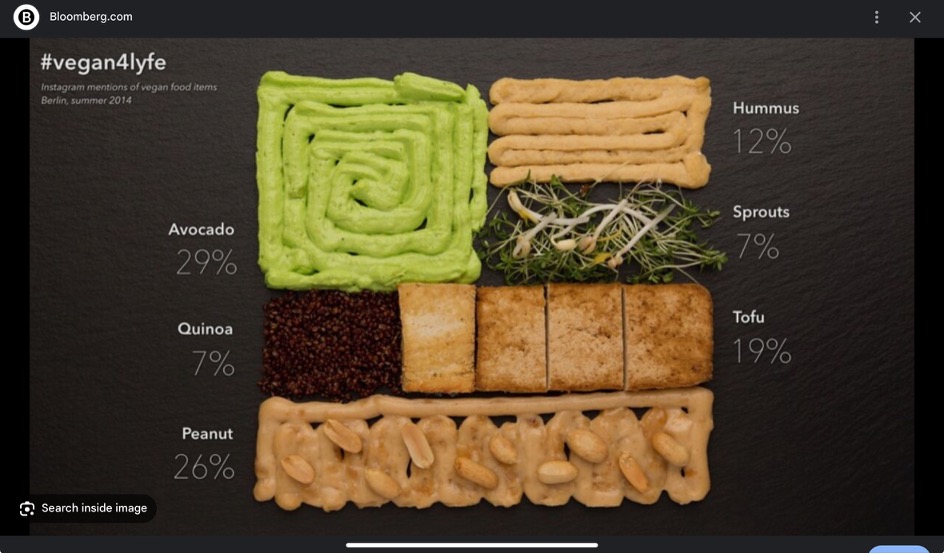
vegan4lyfe
Ebony
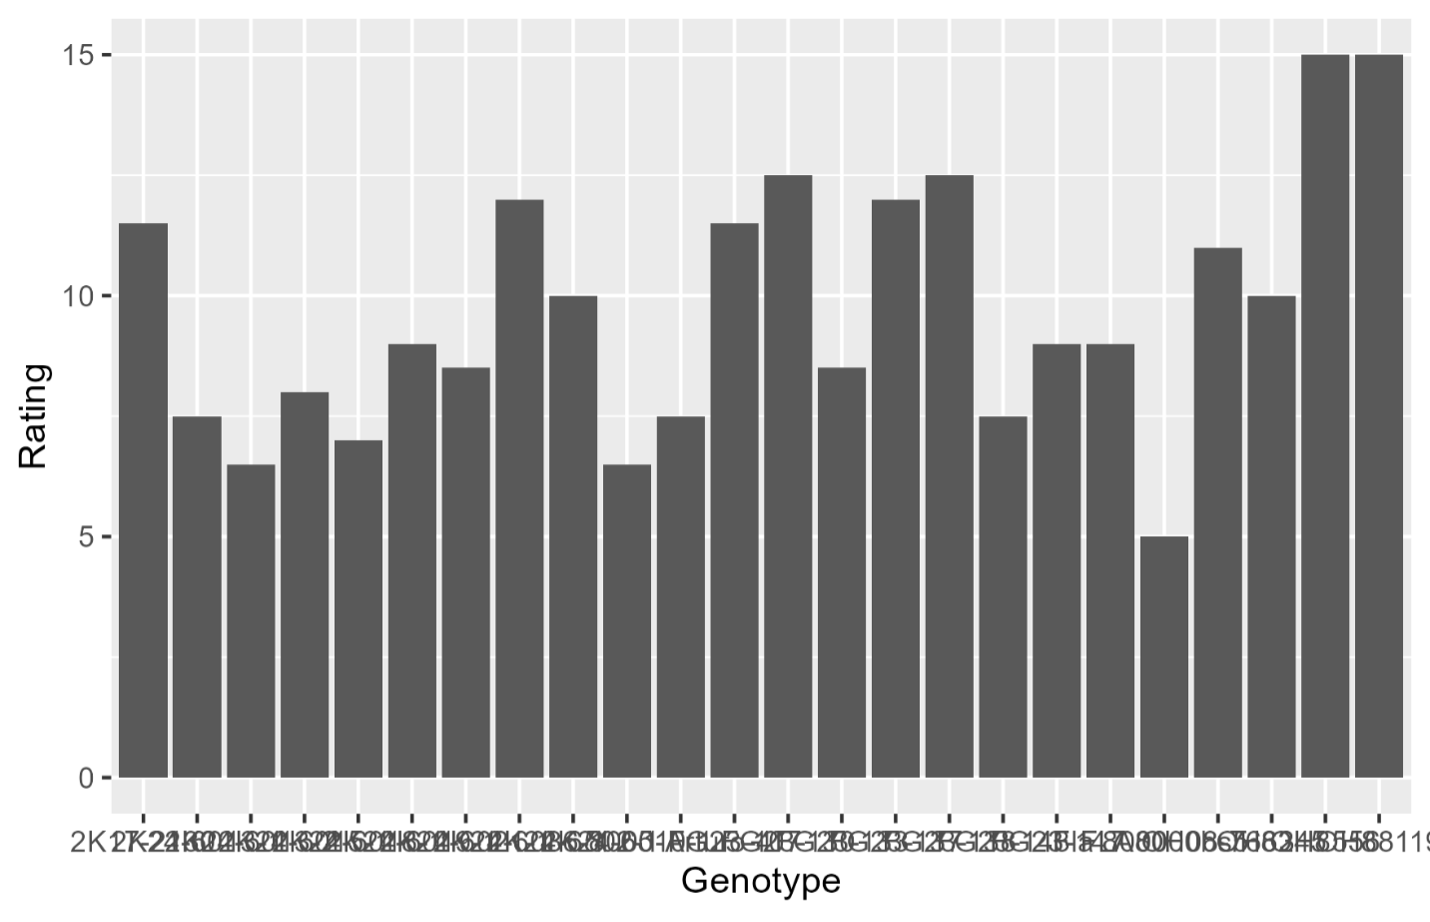
Tomato assessment 🍅
Sarah
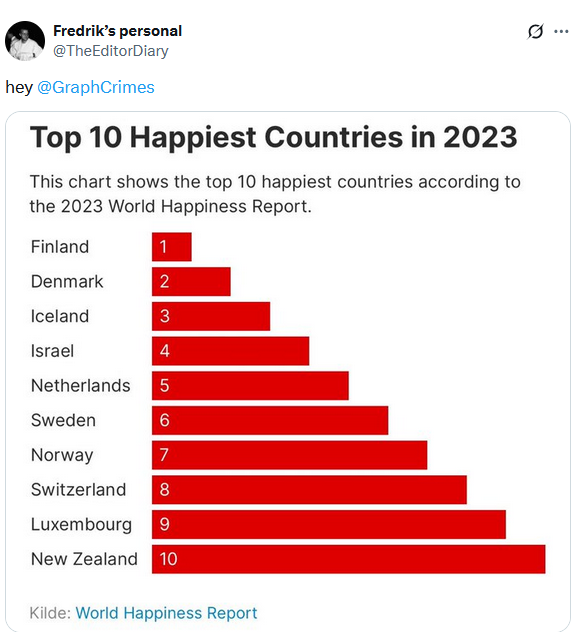
Not so happy 😿
Marvin
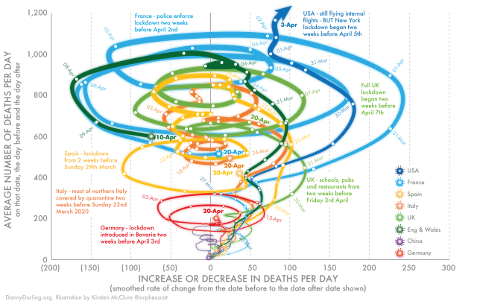
Daniel’s favorite worst!
Mia 🏅
So corny 🌽
Bishal
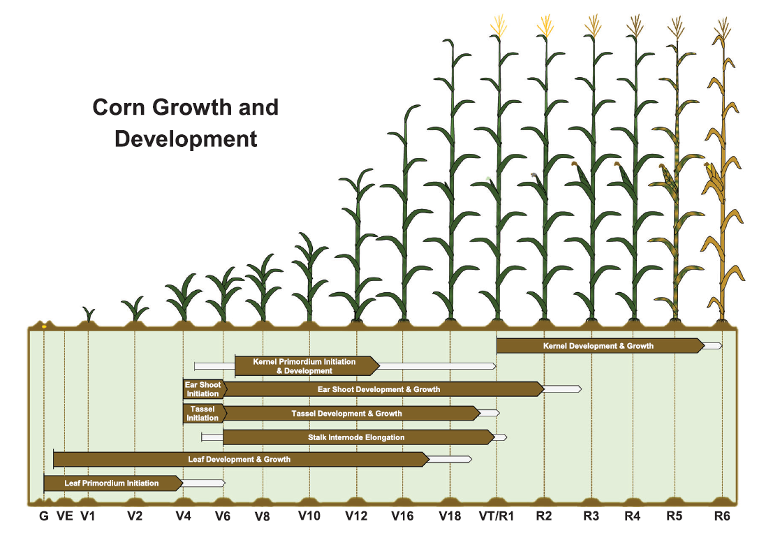
More corn 🌽
Sumita
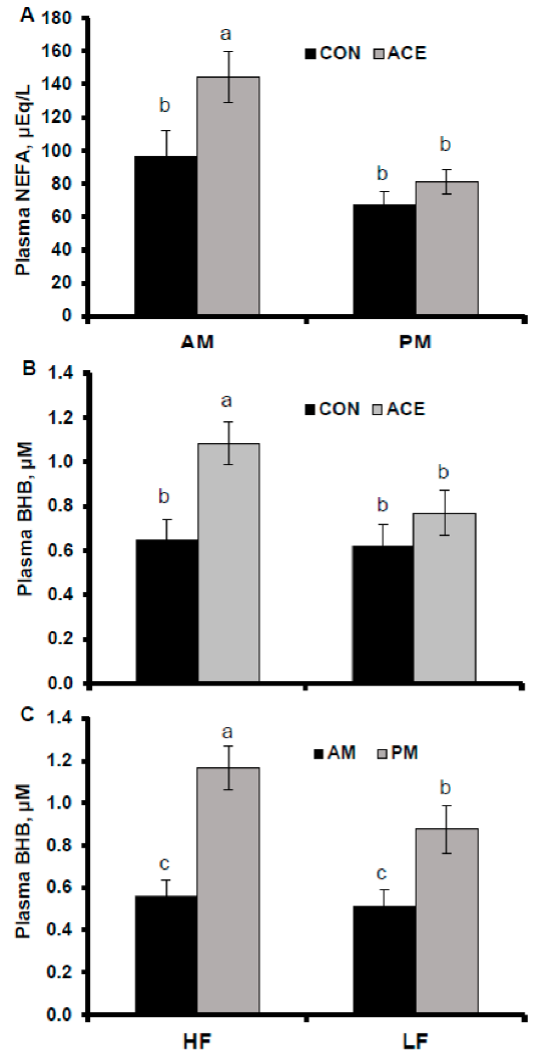
Cow ruminates 🐄
Lucas
Do not pet the boar! 🐖
Erin
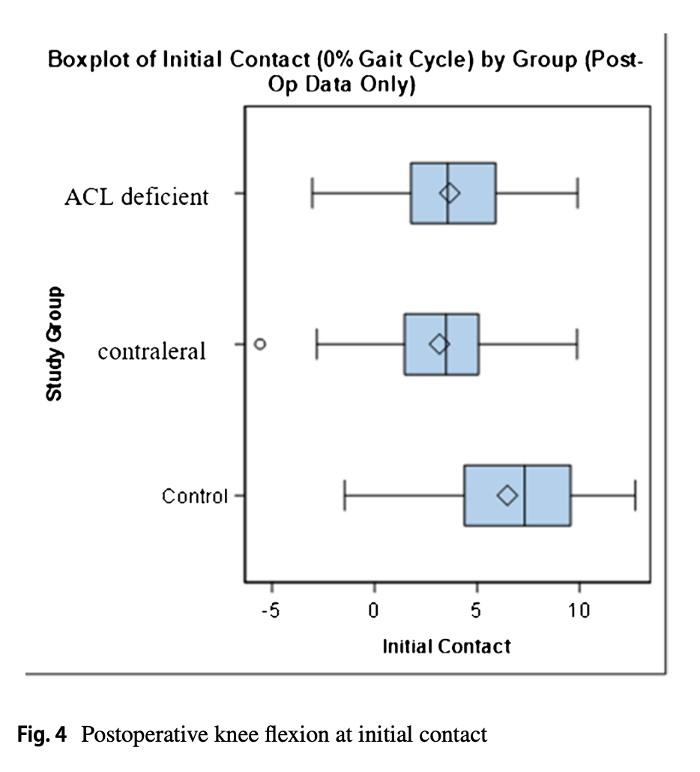
Knee stuff 🦵
Mary
Daniel’s favorite best!
Kaden 🏅